


Qlik QSBA2018 시험 개요:
| 인증 벤더: | Qlik |
|---|---|
| 시험명: | Qlik Sense 비즈니스 분석가 인증 시험 - 2018년 6월 출시 버전 |
| 시험 번호: | QSBA2018 |
| 관련 자격증: | Qlik Sense 데이터 설계자 Qlik Sense 시스템 관리자 |
| 실제 시험 문항 수: | 50 |
| 시험 형식: | 단일 선택형, 다중 선택형 |
| 시험 시간: | 120분 |
| 합격 점수: | 70% |
| 지원 언어: | 영어 |
| 자격증 유효 기간: | 2년 |
| 응시료: | 250달러(USD) |
| 권장 교육: | Qlik 공식 교육 과정 Qlik 도움말 문서 |
| 시험 등록: | Pearson VUE 등록 |
| 샘플 문제: | Qlik QSBA2018 샘플 문제 |
| 응시 방법: | 온라인 감독 시험 또는 Pearson VUE 지정 시험장에서 응시 가능 |
| 전제 조건: | 필수 선수 요건은 없으며, Qlik Sense 실무 경험을 갖출 것을 권장함 |
| 공식 요강 URL: | https://www.qlik.com/us/services/training/certification |
Qlik QSBA2018 시험 요강 주제:
| 섹션 | 비중 | 목표 |
|---|---|---|
| 애플리케이션 개발 | 25% | - 시각화 자료 및 대시보드 구축 - 고급 기능 및 표현식 활용 - 마스터 항목 및 재사용 가능한 리소스 적용 - 애플리케이션 성능 최적화 |
| 요구 사항 파악 | 20% | - 업무상 필요 사항 수집 및 해석 - 사용자 유형 및 접근 권한 요건 결정 - KPI, 지표 및 차원 정의 |
| 데이터 준비 및 로드 | 30% | - 데이터 변환 및 정제 - 효율적인 데이터 모델 구축 - 다양한 데이터 소스에 연결 - 합성 키 및 연관 관계 문제 해결 |
| 애플리케이션 설계 | 25% | - 설계 모범 사례 및 사용성 원칙 적용 - 적절한 시각화 방식 선택 - 애플리케이션 구조 및 탐색 경로 계획 |
최신 Qlik Certification QSBA2018 무료샘플문제
문제 #1
Which two features/functions are enabled by the Qlik Associative Engine?
A. Insight advisor and smart search
B. Smart search and mashups
C. Insight advisor and data profiling
D. Smart search and data profiling
문제 #2
Refer to the exhibit.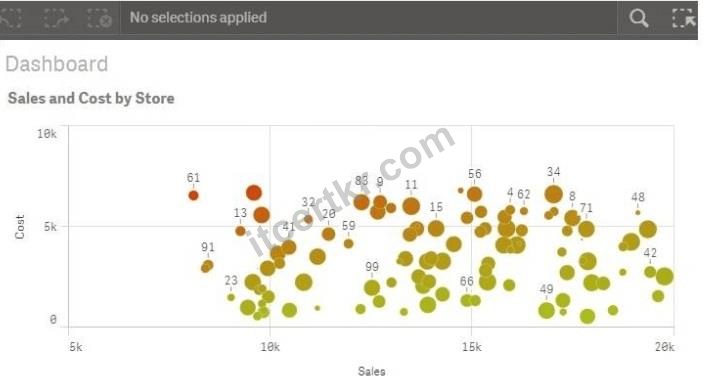
A range of colors between red (using code RGB(229.20,0)) and green (using code RGB(164T196,23)) needs to be used as a gradient in a scatter plot that displays sales and cost by store The gradient needs to produce visualization shown in the exhibit What is the most efficient method a business analyst should use to meet this requirement?
A. Create a new measure in the master items with the Colormix2 function so that the gradient can be used in any visualization
B. Modify the default CSS file to produce the required color gradient
C. Modify the visualization to set a color for the data points with an expression based on a Colormix1 function
D. Create a new calculation in the data model with the Colormix1 function that can be used as a gradient in the visualization
문제 #3
A business analyst is building a dashboard to track customer loyalty. The app has several requirements
* A table that shows the total number of purchases by customer
* A scatter plot that shows the correlation between the number of purchases and total spent by customer
* A bar chart that shows the top five customers by sales
Which two measures should the business analyst use to meet these requirements? (Select two.)
A. Customer Ranking
B. Number of Products
C. Correlation
D. Purchase Amount
E. Number of Purchases
문제 #4

Refer to the exhibit
The data architect informs the business analyst of an additional data source for Customer data The values are stored in a different format Users do NOT need to display values in the current format for the NewCustomer.
The business analyst has split the 'Customer" column into two new fields in the New Customer table.
Which steps should the business analyst take to finish integrating the new customer records into the existing visualizations?
A. 1 Click on the Customer table
2 Select Concatenate tables in the'...' option menu
3 Select the New Customer table
4 Edit Mappings to align the 'Customer Name' and 'Status' columns from the two tables
5 Remove the remaining third column from the 'New Customer" row
B. 1. Click on the NewCustomer table
2 Select Concatenate tables in the '. ' option menu
3 Select the Customer table
4 Edit Mappings to align the 'Customer Name' and 'Status' columns from the two tables
5 Rename the columns to 'Customer Name' and 'Status'
C. 1 Click on the Customer table
2. Select Concatenate tables in the '...' option menu
3 Select the New Customer table
4 Edit Mappings to align the 'Customer Name' and 'Status' columns from the two tables
5 Rename the columns to 'Customer Name' and 'Status'
D. 1. Click on the NewCustomer table
2 Select Concatenate tables in the'...' option menu
3 Select the Customer table
4 Edit Mappings to align the 'Customer Name' and 'Status' columns from the two tables 5. Remove the remaining third column from the 'New Customer* row
문제 #5
A manufacturer uses a dashboard for analysis Users created many bookmarks to simplify their workflow. An administrator also created some bookmarks in the app based on user feedback The organization needs to republish the app and maintain both the users' and administrator's bookmarks Which steps should the business analyst take to meet this requirement?
A. * Create a duplicate copy of the app
* Delete the published app
* Publish the duplicate app
B. * Duplicate the app in Work
* Review previous bookmarks
* Replace the existing published app
C. * Review previous bookmarks
* Copy the app to a new stream
* Publish the app in the new stream
D. * Duplicate the app in Work
* Request bookmark owner to publish bookmark
* Replace the existing app
질문과 대답:
| 문제 #1 정답: A,D | 문제 #2 정답: C | 문제 #3 정답: B,D | 문제 #4 정답: C | 문제 #5 정답: D |


 852 개 고객 리뷰


 품질과 가치ITCertKR 의 높은 정확도를 보장하는 최고품질의 덤프는 IT인증시험에 대비하여 제작된것으로서 높은 적중율을 자랑하고 있습니다.
 테스트 및 승인ITCertKR 의 덤프는 모두 엘리트한 전문가들이 실제시험문제를 분석하여 답을 작성한 만큼 시험문제의 적중률은 아주 높습니다.
 쉽게 시험패스ITCertKR의 테스트 엔진을 사용하여 시험을 준비한다는것은 첫 번째 시도에서 인증시험 패스성공을 의미합니다.
 주문하기전 체험ITCertKR의 각 제품은 무료 데모를 제공합니다. 구입하기로 결정하기 전에 덤프샘플문제로 덤프품질과 실용성을 검증할수 있습니다.
